July 12th, 2025
Top Data Analysis Software to Unlock Business Insights Fast
By Simon Avila · 5 min read

In our current business environment, data is the ultimate currency. Yet, raw data in spreadsheets and databases is just noise. The real value lies in interpreting that data to find actionable insights that drive growth, efficiency, and innovation.
This is where data analysis software comes in. These powerful tools are designed to process, analyze, and visualize data, transforming complex numbers into clear business intelligence.
As you can imagine, the market for these tools is expanding rapidly. The global data and analytics software market reached an impressive $141.91 billion in 2024 and is projected to continue growing at a compound annual growth rate (CAGR) of 13.6% [1]. This growth reflects an urgent need across industries—from small businesses to large enterprises—to make faster, data-driven decisions [2].
This article will guide you through the top data analysis software available today, highlighting their key features and ideal use cases to help you find the perfect fit for your organization.
The Evolving Landscape of Data Analytics
The data analytics space is constantly shifting. In fact, 54% of the top 50 analytics and BI software products in 2025 were new to the list compared to the previous year, signaling rapid innovation and shifting user demands [3]. Three key trends are shaping this evolution:
• Pervasive AI Integration: Artificial intelligence is now a cornerstone of modern analytics. Platforms like Microsoft Power BI are integrating AI-powered tools like Copilot, which allows users to query data using natural language [4]. Similarly, Tableau has introduced Tableau AI to enhance its analytical capabilities [5].
• Embedded Analytics: Businesses increasingly want insights delivered directly within their existing applications and workflows. Tools like Sisense Fusion Analytics excel at this, enabling users to make decisions without switching contexts, which boosts adoption and speed [6].
• Democratization of Data: There is a strong shift towards self-service platforms that empower non-technical business users to perform their own analysis. No-code and conversational AI interfaces are making data accessible to everyone in an organization, not just a dedicated team of analysts.
Top-Tier Business Intelligence and Analytics Platforms
These platforms are the powerhouses of the data world, offering comprehensive solutions for large organizations that need to manage and analyze data at scale.
Microsoft Power BI
A dominant force in the business intelligence space, Power BI is known for its powerful interactive visualizations and seamless integration with other Microsoft products like Azure and Office 365 [5]. Its latest versions feature advanced AI tools that improve the relevance of AI-driven analytics and enable real-time, actionable insights through natural language queries [4].
Tableau
Tableau is celebrated for its user-friendly, drag-and-drop interface that allows users to create stunning and insightful visualizations with ease. It is capable of connecting to a vast array of data sources and handling very large datasets, making it a favorite among data analysts and business users alike [5].
SAS Analytics
For decades, SAS has been a go-to for enterprises requiring deep statistical analysis, data mining, and predictive modeling. Its cloud-native SAS Viya platform has modernized its offering by integrating AI, machine learning, and natural language processing, making its powerful tools more accessible [4]. It is widely used in highly regulated industries like finance and healthcare for critical tasks like risk management and compliance [1].
Other Enterprise Leaders
• Qlik: Focuses on end-to-end data integration and analytics, helping organizations consolidate data from diverse sources and automate workflows with AI [6].
• Sisense: A leader in embedded analytics, Sisense enables companies to infuse analytics directly into their products and internal workflows, supported by strong data preparation features [1].
• Looker (Google Cloud): A top-rated platform that provides a unified view of data, enabling consistent business metrics and self-service exploration [3].
Specialized and Developer-Focused Tools
This category includes programming languages and specialized software that offer unparalleled flexibility and power for data scientists, statisticians, and developers.
Python and R
• Python: Prized for its versatility and extensive collection of libraries like Pandas (for data manipulation), NumPy (for numerical computation), and Matplotlib/Seaborn (for visualization). It is often used within Jupyter Notebooks, which provide an interactive environment for coding and analysis [7].
• R: Built by statisticians for statisticians, R offers an exceptional ecosystem for statistical modeling and data visualization [5]. It is typically used with the RStudio IDE, which simplifies development and analysis workflows.
Apache Spark
When dealing with massive datasets (terabytes or even petabytes), Apache Spark is the industry standard. It is a powerful, open-source distributed computing system designed for big data processing and analytics. Spark supports multiple languages and includes libraries for SQL, streaming data, and machine learning at scale [5].
IBM SPSS Statistics
A long-standing tool in academia and research, SPSS provides a comprehensive set of features for advanced statistical analysis, hypothesis testing, and predictive modeling without requiring extensive programming knowledge [3].
The New Wave: AI-Powered, Conversational Analytics
While traditional BI tools and programming languages are powerful, they often come with a steep learning curve. A new generation of software is leveraging AI to bridge this gap, making sophisticated data analysis accessible to everyone.
Julius AI is a prime example of this trend. It is an AI-powered data analysis platform that operates through a simple, conversational interface. Users can upload a file (like a CSV or Excel sheet), and then analyze and visualize the data simply by asking questions in plain English.
For instance, a marketing manager could upload campaign data and ask, "What was the click-through rate by ad creative?" or "Show me a chart of conversions over time." Julius interprets the request, performs the analysis, and generates the corresponding chart or insight instantly. This approach is ideal for knowledge workers who need quick answers from data but don't have a dedicated analyst or programming skills. It's also a powerful productivity tool for data scientists, as it automates tedious tasks like data cleaning and basic visualization [7].
How to Choose the Right Data Analysis Software
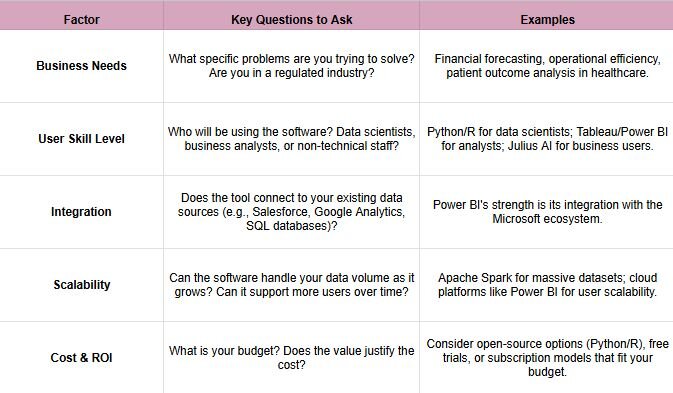
Selecting the best tool depends entirely on your unique circumstances. Consider the following factors before making a decision.

Final Thoughts
The right data analysis software can be a transformative investment, turning your raw data from a dormant asset into a strategic advantage. The market offers a wide range of options, from comprehensive enterprise platforms like Power BI and SAS to flexible programming languages like Python and R.
Crucially, the rise of AI-driven, conversational tools like Julius AI is democratizing data analytics, empowering more people than ever to ask questions and get answers from their data. By carefully evaluating your business needs, user capabilities, and budget, you can select a tool that not only provides insights but also fosters a culture of data-driven decision-making across your entire organization.
Want to try your hand at better AI-powered data analysis today? Then use Julius AI for free and see why over 2 million users trust it.
